Analysis Tools
Analysis is focused and rigorous thinking intent on discovering how something works or why it doesn't. When you analyze something, you break it into parts, examine each to see how it functions, and trace the connections among the parts. You can use questions and graphic organizers to analyze topics.
5 W's and H
Six questions help you define any situation: Who? What? Where? When? Why? and How? Journalists answer these questions to make sure their stories provide complete information. A party invitation also answers these questions. Anytime you are trying to define a problem or other situation, begin your analysis with the 5 W's and H.
These questions also help you create a strategic plan. Use a Planning Sheet to write a goal statement. Then add objectives by answering the 5 W's and H. As you enact your plan, you can measure your progress using a Goal/Objectives Evaluation Sheet—one more way that the 5 W's and H can guide your thinking.
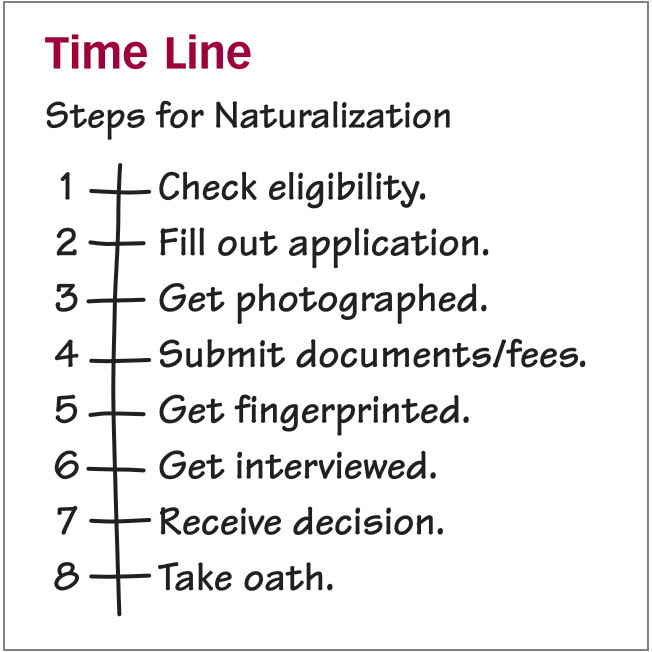
Time Line (Google Doc)
A time line organizes events chronologically. You can use a time line to analyze past events, such as the merger of two companies. A time line can also help you outline future events, for example, a procedure for applying for citizenship. The simplest time lines are numbered lists, but more complex ones include dates and multiple columns of concurrent events.
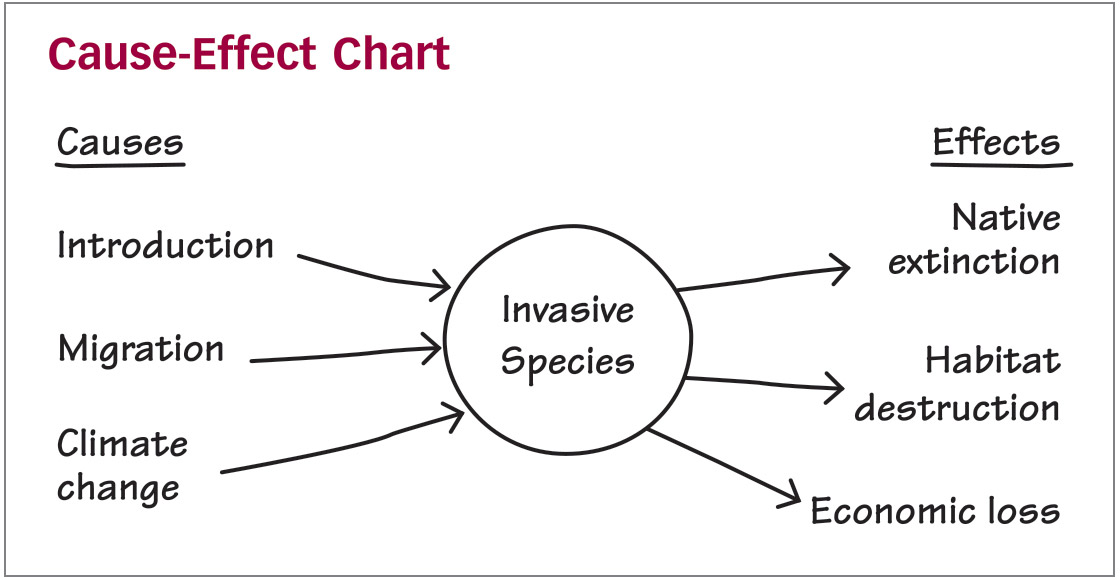
Cause-Effect Chart (Google Doc)
A cause-effect chart names a phenomenon and lists reasons it occurs and the conditions that result. The chart below places the phenomenon in the center, with causes converging from the left and effects emerging from the right. The version in the download records causes in the left column and effects in the right.
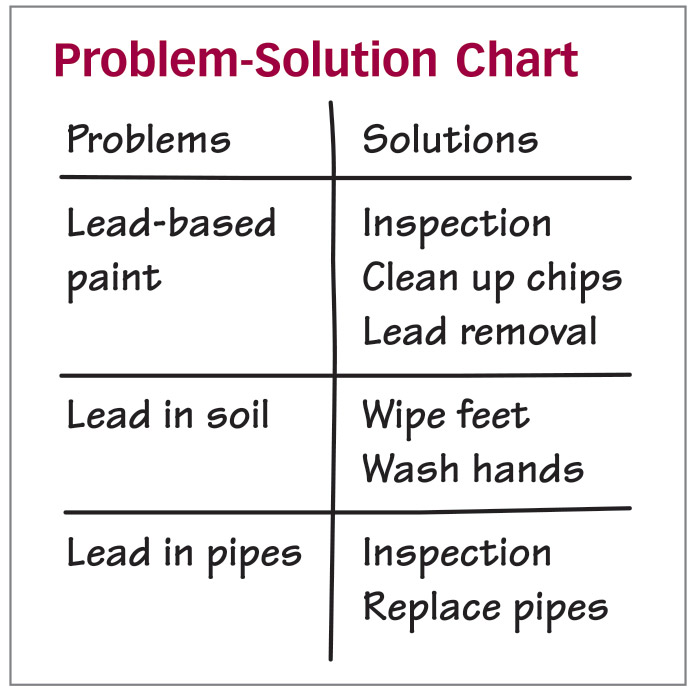
Problem-Solution Chart (Google Doc)
A problem-solution chart helps you analyze a series of related problems and propose solutions. Often, the best way to devise solutions is to target one or more causes of a problem, or one or more effects. For that reason, you can use this chart in tandem with the cause-effect chart.
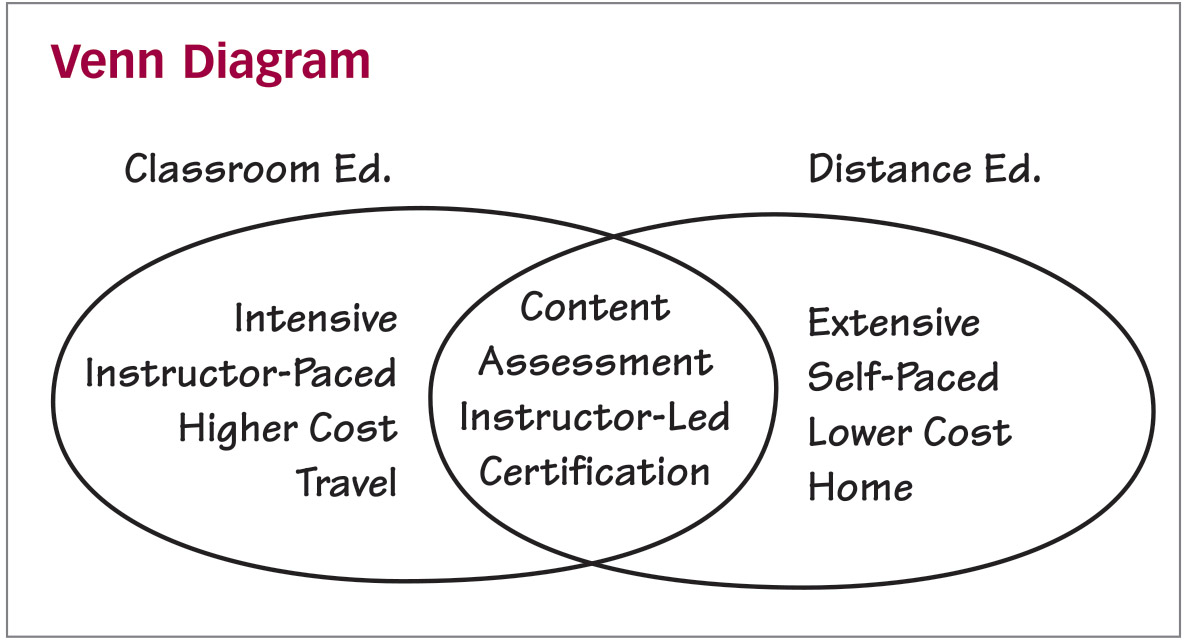
Venn Diagram
In a Venn diagram, one oval represents one topic, and the other represents a different one. The overlapping space contains similarities, and the spaces that do not overlap show the differences. This graphic organizer helps you compare and contrast. You can add more ovals to analyze three or more topics.
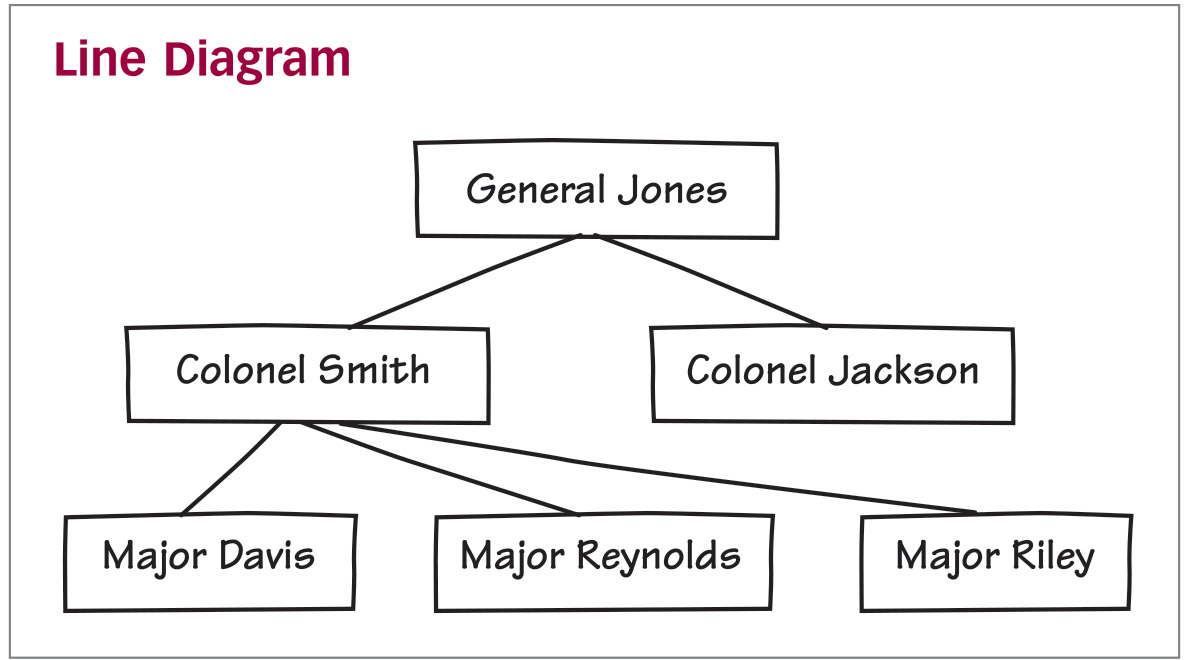
Line Diagram
A line diagram shows a branching hierarchy, such as a corporate structure or a website map. Boxes and lines represent the interconnection of different elements. This graphic organizer helps you visualize structures that are nonphysical in nature.
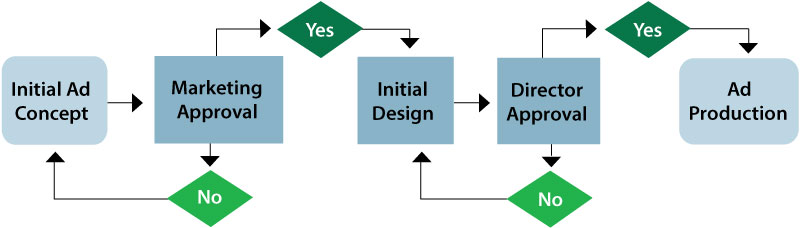
Flowchart
A flowchart represents a process. Ovals indicate start and end points, and arrows show the direction of flow. Rectangles contain individual steps or stages, and diamonds mark decision points. More advanced flowcharts use parallelograms for outputs and inputs, document icons for information, and other figures. This flowchart traces the process of designing an advertisement.
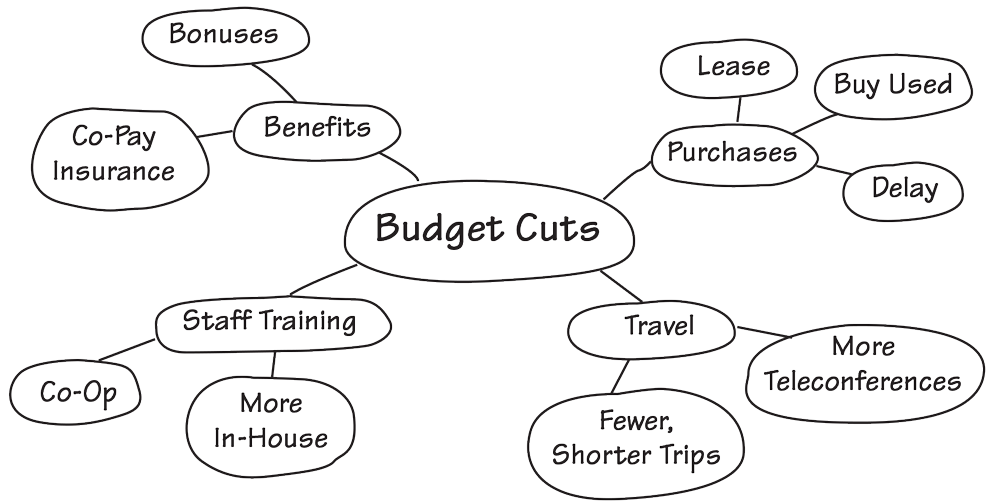
Cluster
A cluster or mind map shows the nonlinear connections between a general topic and specific subtopics. Write the topic in the center and circle it. Then cluster related ideas around it and connect them. This graphic organizer helps you classify and categorize a complex topic. It can also help you explore an issue by brainstorming possibilities.
Using Analysis Tools
You can use any of these strategies to spur your own analysis and to give others a context in which to think.
Thought Aids: Use any of these analysis tools to spark your initial thinking about an issue.
Organizational Aids: Use analysis strategies to arrange details from your research.
Visual Aids: Use these tools within presentations to help your audience understand and visualize concepts.